3D · Real-time · Dashboards

Turn 3D scenes into
real-time dashboards

GTU 3D Viewer turns GB-scale 3D models into scenes you can roam in the browser and orchestrates them with live data into dashboards. Build in the workbench, cast to a screen — open a browser and watch.
98.4 %
Devices online · live
27.7 °C
R&D center · env station
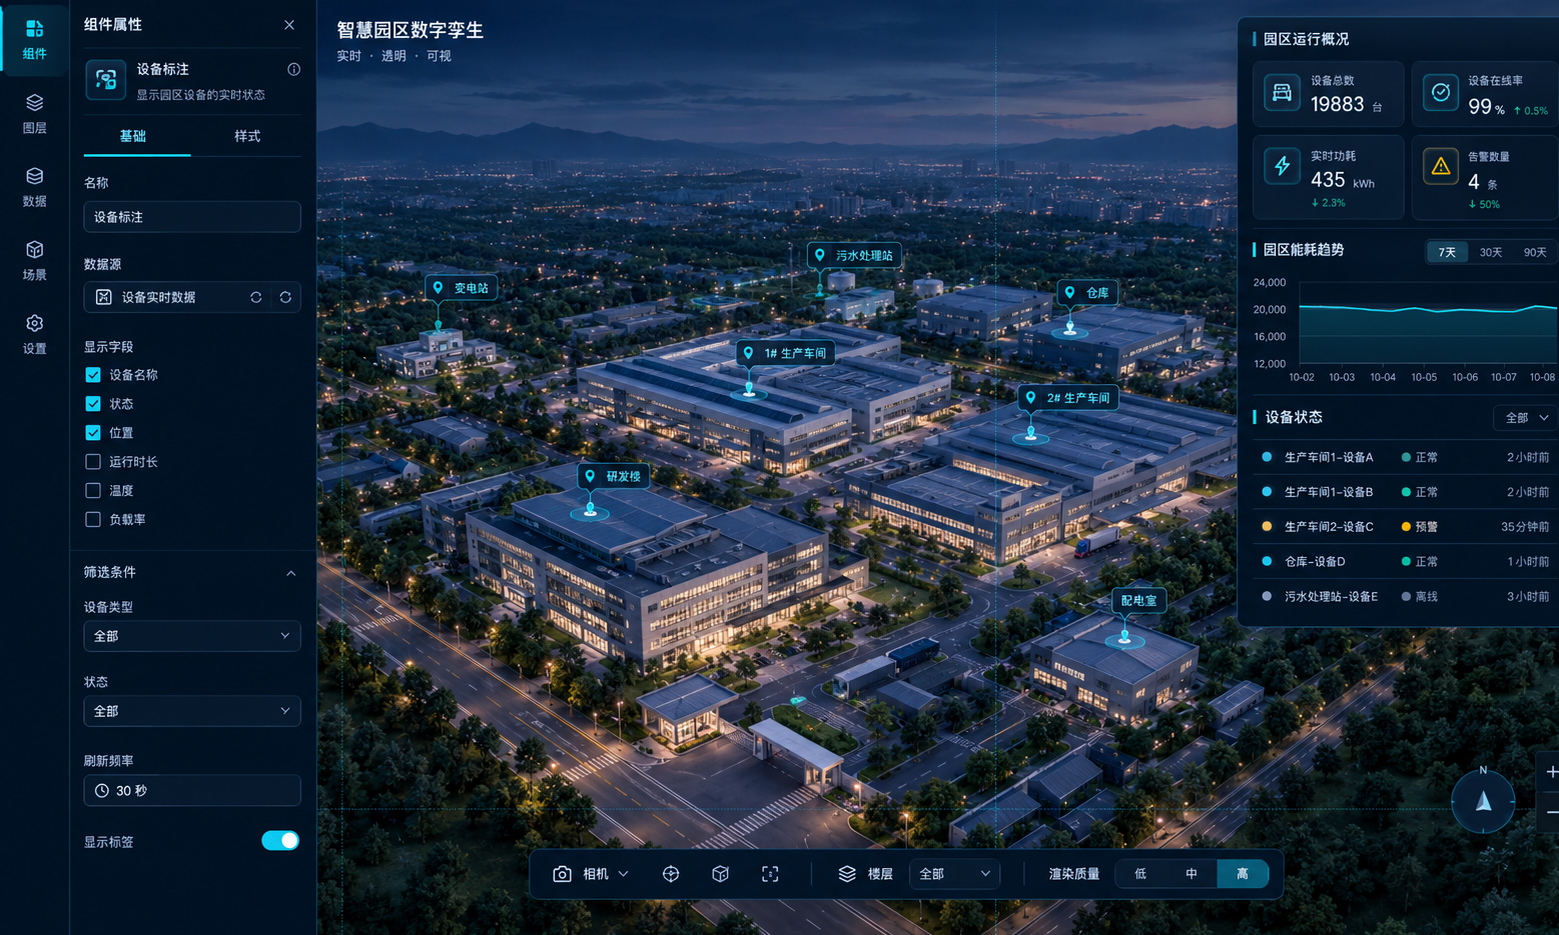
Smart-park digital twin · live workbench view
01 — 3D Agent

While you talk, the dashboard gets built

The 3D agent is a full production capability: from data hookup to dashboard build, one conversation does it all.

3D Agent
Online · on standby
MCP · 28 tools

Created data source Chiller Telemetry — connectivity test passed, 100-row preview normal.

create_datasourcetest_datasource

Applied the energy template to create Park Energy Monitor — 5-slot layout complete.

create_dashboardupdate_dashboard

6 chiller points bound to live values, 5 s polling; every binding returns good frames.

create_pointget_dashboard_data

The dashboard is ready — cast and go.

Preview dashboard
Hook up data
Just name the source and the metrics — HTTP / MySQL / PostgreSQL. Connectivity tests, field extraction and point binding are handled for you; credentials never touch the browser.
Build the dashboard
Templates, layout and KPI binding take shape line by line in the conversation; every data frame is auto-validated, failures auto-retry, stop or roll back anytime.
Same origin and truth as REST · Streamable HTTP · Bearer auth available for remote access
02 — Build pipeline

One platform, from model to live dashboard

No installs, no tool juggling, no export/import — model files in, live dashboards out.

  1. 01
    Upload models
    Upload common 3D model files directly; pull huge files from a server URL too
  2. 02
    Auto conversion
    Web optimization runs automatically — GB-scale models roam smoothly in the browser
  3. 03
    Assemble the dashboard
    Drag and drop the layout like slides; mix metrics, charts and pages freely
  4. 04
    Connect data
    Hook up existing systems and databases; live data maps and refreshes automatically
  5. 05
    Live dashboard
    3D scene and live data pulse on one screen — ready for the duty wall, stop anytime
03 — Core capabilities

Everything a live-beating dashboard needs

Massive models, straight in the browser

No plugins, no full-model downloads. Streams by camera view and screen-space error — an ordinary browser roams GB-scale scenes smoothly.

Draco + KTX2 · Spatial HLOD · Babylon.js 9

3D fused with live data

Pin points to key equipment, bind KPI and chart panels to live data sources, tune polling per dashboard — scene and panels pulse on one screen.

1–3600 s polling · JSONPath extraction

Multi-source data hookup

HTTP, MySQL, PostgreSQL, static and demo sources. Connectivity tests and preview queries; credentials never reach the browser.

Secrets never sent down · reference lists guard deletion

3D agent, conversational building

Tell it what you need: hook up data, build the dashboard, verify the result — all in conversation. 28 MCP tools, same origin and truth as the UI.

Conversation-driven · same origin & truth as REST

Turn your models into
real-time dashboards.

Upload a 3D model and build your first live dashboard in minutes.